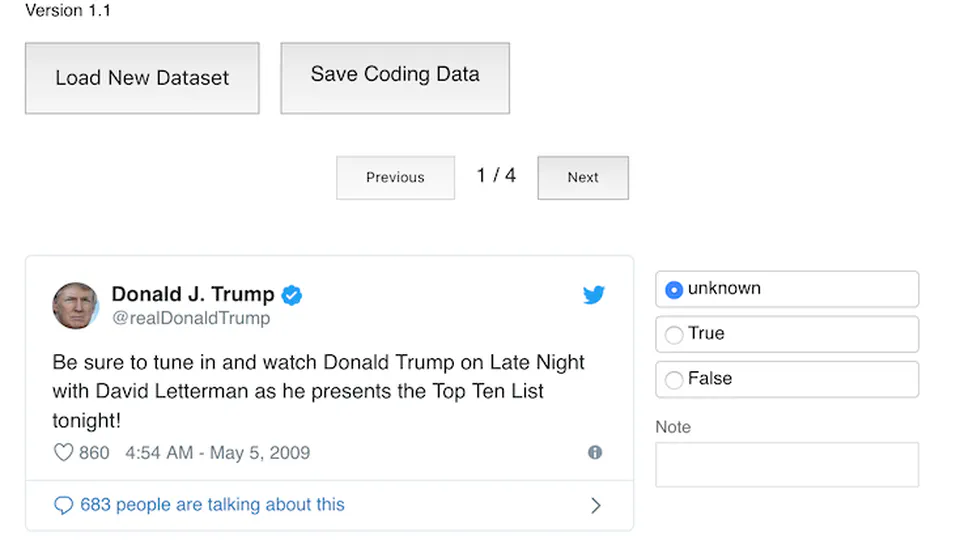
TweetCoding is a tool for simple coding of tweets. It displays 5 tweets per page using Twitter’s tweet embedding to display each tweet as it looks on the Twitter website on a local web page. It needs internet access to get the tweets from Twitter, but all coding data is stored on your computer, not the internet.
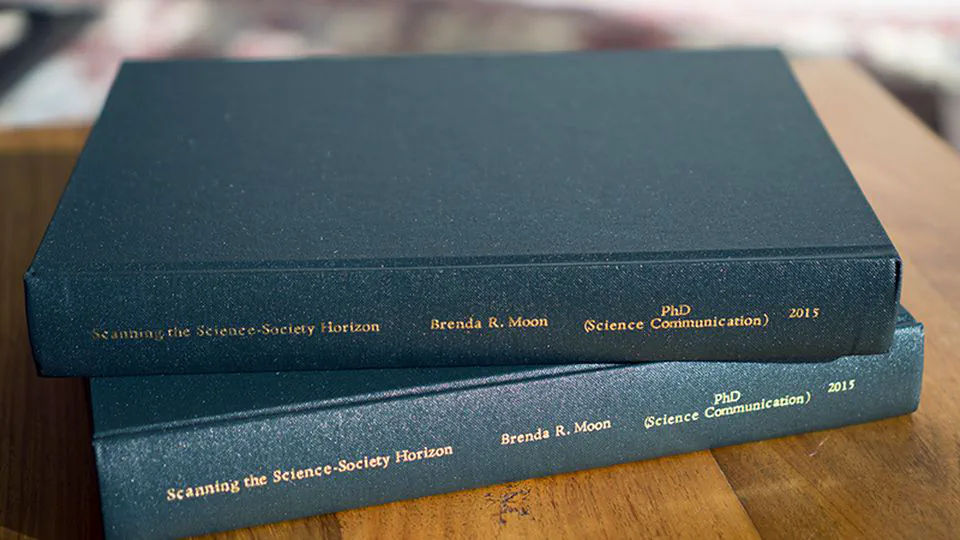
It is my pleasure to advise you that on 18 April 2016 the relevant Delegated Authority of the ANU Colleges of Science confirmed the approval of the award of your degree of Doctor of Philosophy. Congratulations on this significant achievement.
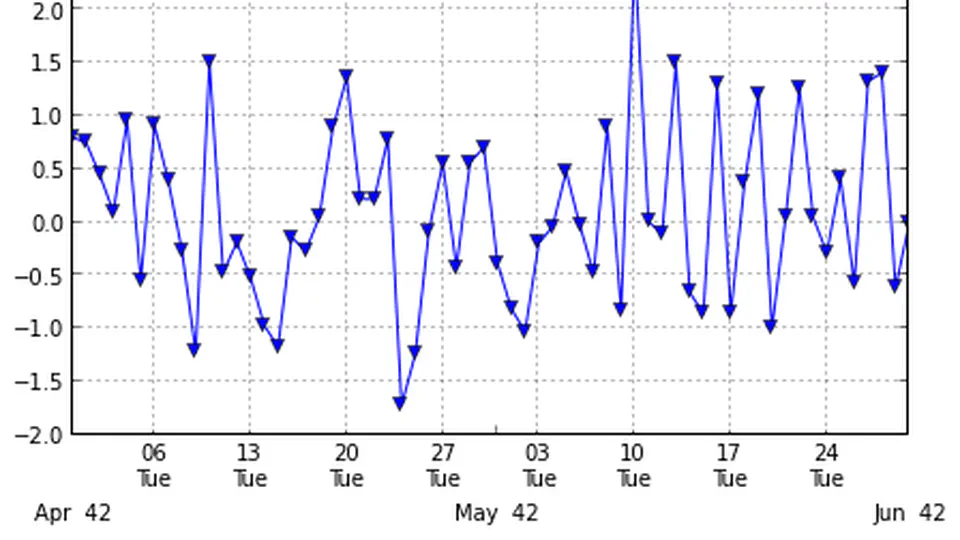
I’ve asked this question on StackOverflow (http://stackoverflow.com/questions/12945971/pandas-timeseries-plot-setting-x-axis-major-and-minor-ticks-and-labels), but couldn’t include images because I haven’t posted on stackOverflow before. So here it is, with the images. I want to be able to set the major and minor xticks and their labels for a time series graph plotted from a Pandas time series object.
I have released the Java programs that I’ve been using to collect data from Twitter for my PhD since November 2009. It is suite of programs that use the Twitter Search API and Twitter Stream API to get tweets and then store them in a mySQL database. They have been tested on Mac OS X and Debian Linux.
On June 18th I was awarded the 2012 ANU Award for Excellence in Tutoring or Demonstrating. The award was presented by DVC (Academic) Professor Marnie Hughes-Warrington at a celebration during ResearchFest. I was one of three joint winners to receive the award, from a pool of 38 nominees and hundreds of ANU tutors and demonstrators.
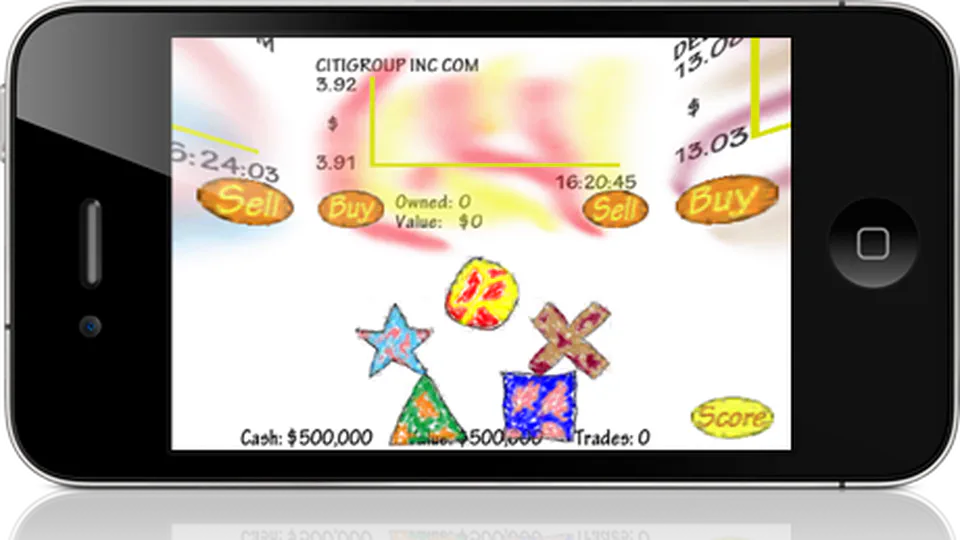
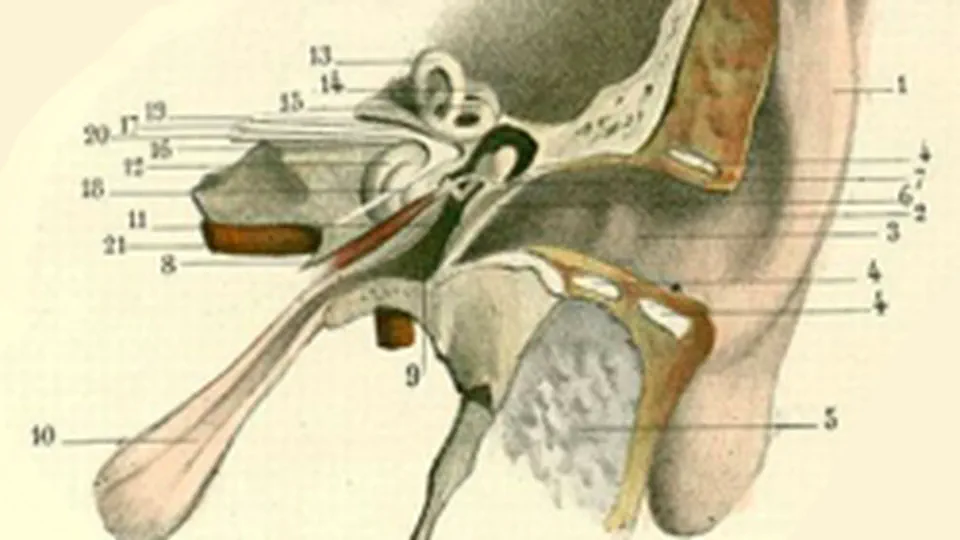
Hearing the Unseen has evolved into an iphone game and generative music machine called Ear Trading. It is now ready for beta testing after which it will be released as on the iTunes store as a free application.
This is based on a Poster/Demo presented at the “Humanities + Digital Visual Interpretations Conference” hosted by HyperStudio - Digital Humanities at MIT 20-22 May 2010. Ear diagram Barry Moon Arizona State University Brenda Moon The Australian National University This project started as a exploration of data sonification techniques. The abstract published in the conference program is a testament to this. As it progressed, the idea of using real-time data to create a game for mobile devices became more alluring. More specifically, a game where sound plays a major role in decision making, or even a game that produces interesting music with minimal interaction. For this application, the meanings of the data become far less important than its trends and time basis. We are using stock market data which wakes up and goes to sleep at fixed times of the day. Music, being predominantly time based, suits this kind of predictable framework upon which to drape its material. Although the creation of a game is the direction our sonification research has taken us, similar techniques could be applied to data to not only reveal details, but make the exploration of those details interesting and fun.
I’ve been trying out the MSAFluid library by Memo Akten for Processing. Starting from the example program that comes with the library, I’m making a wind tunnel. I’ve seperated adding force to the fluid, adding particles and adding dye so that I can add each where I want to.